
These four cities – home to a total of more than 80 million people – respond to economic, political and environmental shifts in radically different ways. LSE Cities crunches the data on growth, transport and density

Delhi is over three times more densely populated than London at its peak, with 75,000 people per sq km. Scroll down to see the density map for all four cities. For full references to data sources please see lsecities.net
Cities are not static. Like living organisms they change and adapt over time. Some grow and others shrink in response to economic, political and environmental shifts. But they do this in radically different ways, reflecting local responses to regional, national and global changes. Recently, LSE Cities focused on the patterns of growth, governance, transport and density of the four national capitals of Japan, India, Colombia and the UK. Together, the metropolitan areas of Tokyo, Delhi, Bogotá and London have over 80 million residents (equal to the population of Germany) and, according to the Brookings Institution, a combined GDP of $2.2 trillion, the size of the Brazilian economy or three times that of Saudi Arabia.
Tokyo has become a highly efficient global megacity in the last four decades – but despite its enviable integrated public transport system and the forthcoming Olympics in 2020, the city is likely to lose 400,000 people over the next 15 years as a result of low-birth rates and a slowing national economy. London, by contrast, has just come out of the demographic doldrums – overtaking its historical high of over 8.6 million (its size in 1939) and riding high on its global economic pulling power (it has just come top of the Mori Memorial Foundation index of city ‘magnetism’). Such levels of growth are fuelled by a dynamic birth rate (twice that of Rome or Madrid) and strong in-migration attracted to London’s resilient economy, promoted aggressively by its proactive mayors.
The Colombian capital of Bogotá, with a city population slightly smaller than London at 8 million, has built on the intelligent policies of successive mayors to cope with typical Latin American patterns of informality, violence and unregulated growth. Famous for introducing the Transmilenio Bus Rapid Transit and an extensive system of cycleways (ciclovías, which predate Boris bikes by a decade), Bogotá is seen as a regional exemplar (alongside Medellín) on how to manage urban change. Despite being, or perhaps because it is, the capital of the world’s largest democracy, Delhi is still struggling to find a political voice. After pioneering efforts by the former chief minister to build a metro system and introduce natural gas to its buses and rickshaws, the metropolitan area of more than 23 million people has witnessed a sharp increase in inequality even though it remains one of the safest megacities in the world, with 2.7 homicides per 100,000 people compared to Bogota’s 16.1.
Current debates about the efficiency of urban governance gravitate around the ‘fit’ between the size of the administrative boundary controlled by a city mayor or governor, and the actual number of people who live in the ‘wider functional metropolitan’ area. Many cities spill across multiple political jurisdictions as their populations and footprints have grown over time, leading to fragmented decision-making and lack of co-ordination even though they all ‘belong’ to a continuous urban agglomeration. For example, only seven million of Mexico City’s 22 million residents are actually controlled by the city mayor of the Distrito Federal while the majority lives (and pays taxes) in the neighbouring political districts. The inability of a metropolitan-wide entity to raise money and determine policy and investment strategies for the entire ‘functional’ area, inevitably leads to dysfunctional transport, infrastructure, housing and environmental policies which can’t be solved within the confines of restricted political boundaries. Sustainable commuting patterns or water supply systems, for example, cannot be implemented without some level of control across broader geographical areas that extend well beyond the city limits of these, and other, global cities.
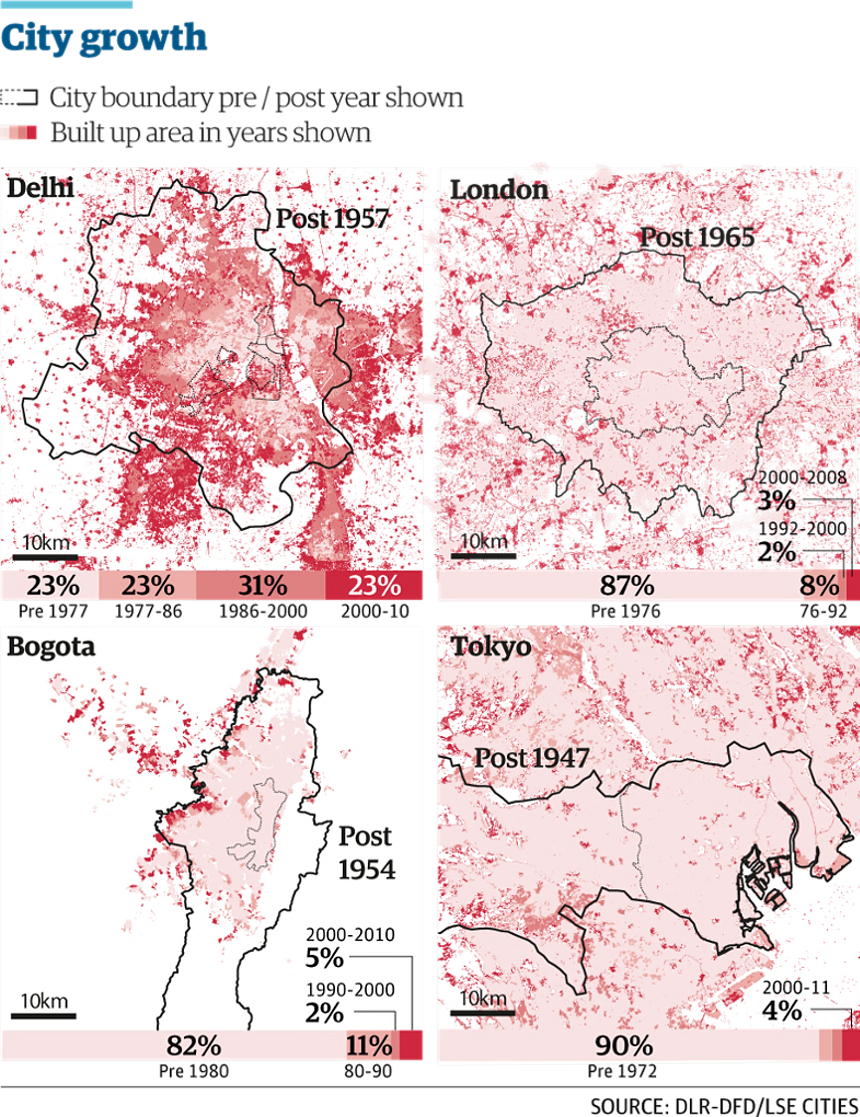
Using data from the DLR-DFD (the German Space Agency), we tracked how administrative boundaries have changed in recent decades in the four cities. While 8.4 million Londoners are now under the jurisdiction of the mayor, they still only make up 39% of the more extensive economic region of the South-East of England, which contains 21.8 million. Similarly, the governor of Tokyo is responsible for only 34% of one of the largest metropolitan agglomerations in the world with nearly 40 million inhabitants. Delhi at 66% and Bogotá at 82% have a relatively greater share of the population of their respective metropolitan region.
The four cities have responded in different ways to urban expansion. Tokyo and Delhi in effect implemented oversized governance systems over 60 years ago and have waited for the city to catch up. Tokyo’s Metropolitan Organisation Act of 1943, which merged the Prefecture and City to form the Metropolis of Tokyo, made the new institutional boundaries three times larger than its boundary at the time. Similarly, Delhi’s 1947 independence boundaries covered 19 times the area of Old Delhi (Shahjahanabad) and Lutyens’ New Delhi. Today, the built-up areas of both have spilled over these ‘historic’ boundaries, with Delhi showing high levels of new development in the neighbouring states to the south and east of the traditional city boundary. Delhi’s built area is still growing rapidly, while Bogotá and Tokyo experienced their growth spurts towards the end of the last century.
The 1943 Greater London Plan defined the political boundary of the then London County Council at what was roughly the limit of the built-up area, but reinforced it with the implementation of the Green Belt. By 1965 the London County Council gave way to the Greater London Council which covered five times the area (which coincides with today’s Greater London Authority boundaries). In 1954, Bogotá’s Special District enlarged the city boundary to 37 times its former size, and while much of the administrative area remains unpopulated (due to topography and land constraints) the majority of recent growth is concentrated.
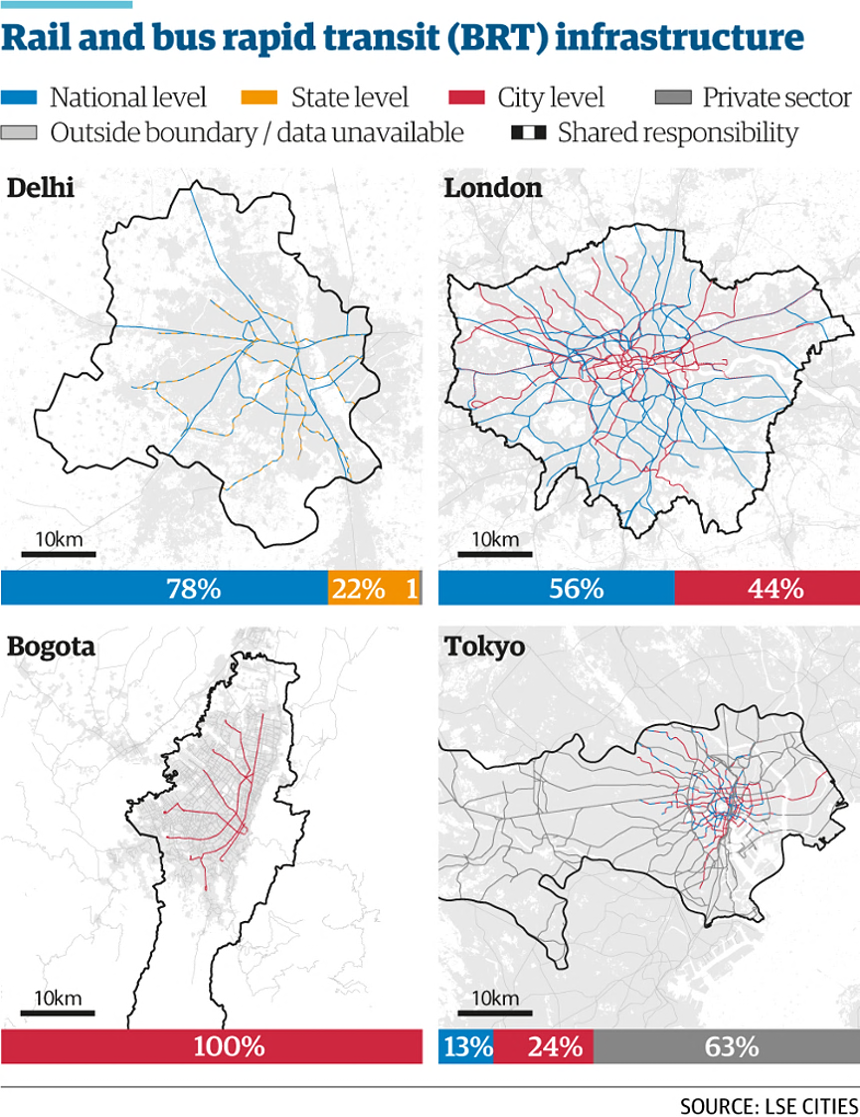
Delhi, Bogotá, London and Tokyo, have pioneered innovations in transport in the last few decades, from Tokyo’s highly integrated transport system to Delhi’s new Metro, London’s Congestion Charge, Boris Bikes and CrossRail to Bogotá’s Bus Rapid Transit (BRT) and ciclovías. The colours of routes on the maps identify which level of government – national, state, city, local and shared responsibility – owns and manages different parts of the network. The bar charts indicate the percentage of the type of city transport infrastructure managed by each government level.
In London, there is a separation between ownership and operations – with some private companies managing buses and trains – while the public sector (mayor and boroughs) still maintains the strategic and managerial power over the base infrastructure. Delhi’s BRT route (50% private sector funded) and Tokyo’s rail privatisation (representing 63% of the transport infrastructure) confirm the growing importance of private sector investment in public transport infrastructure. Although national governments traditionally control and fund the management of rail-based public transport, this research confirms that they play a less significant role than the sub-city level when it comes to roads. In London, local boroughs manage 90% of roads, while the Mayor (through Transport for London) controls the major arteries which carry 30% of the city’s traffic.
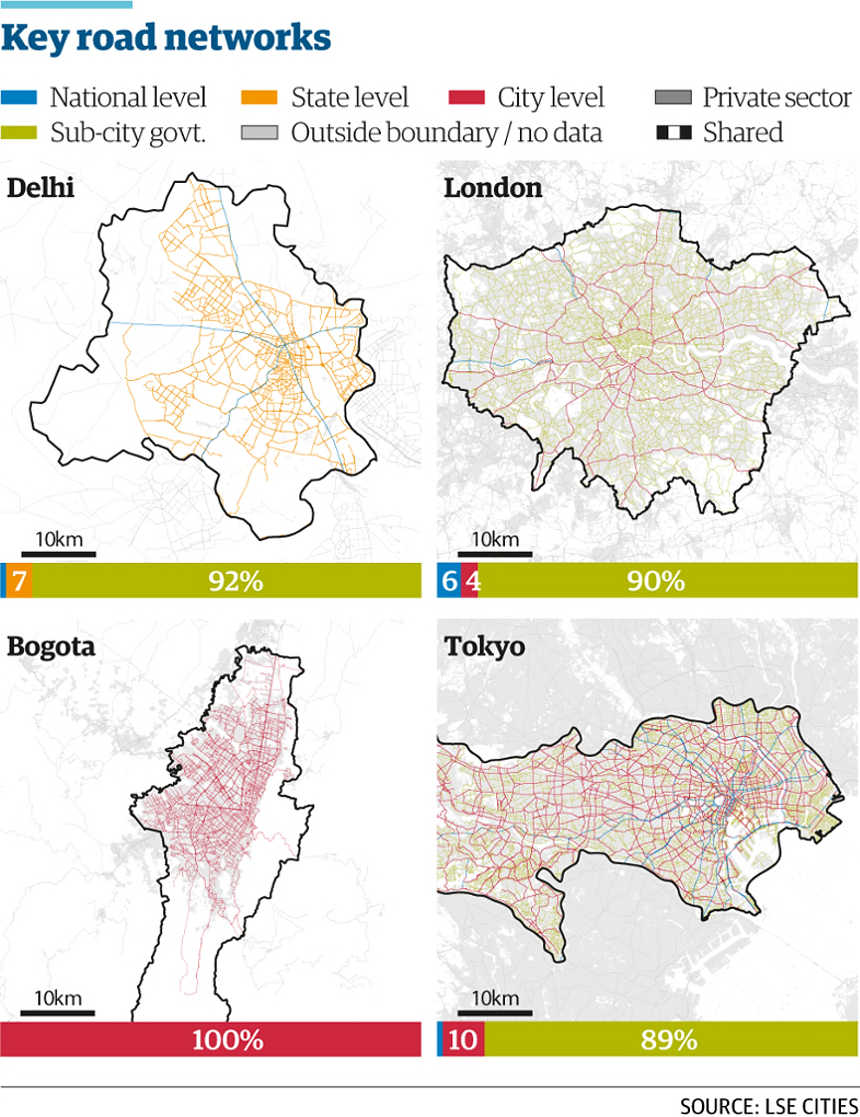
Local boards control 89% of the roads in Tokyo. Infrastructure management at the level of the municipality represents an advantage in terms of the exercise of democracy and responsiveness to citizens, but economic growth and the availability of resources will struggle to keep apace of the requirements of urban populations. As a result, support from the private sector or national government will become even more significant to the sustainability of urban transport systems in the future.

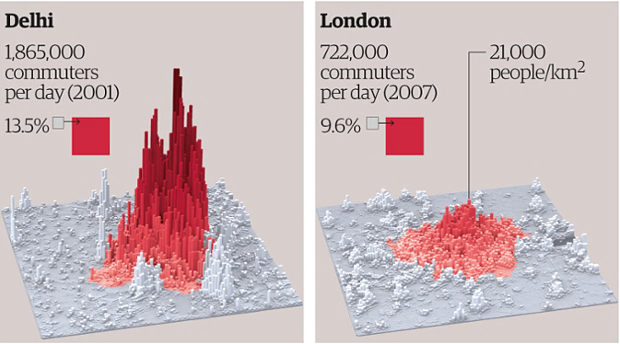
Density is a fundamental measure of urban structure and determines the efficiency of its urban footprint. In these diagrams, the number of people living in a square kilometre – the ‘ambient population density’ over 24 hours – is represented for the four case study cities. Across an area of 100×100 kilometres, the diagrams illustrate this density of ‘occupation’ in any part of the city over a 24 hour period.
The taller spikes in the diagrams represent higher numbers of people concentrated in particular locations – dense residential areas, central business districts, event spaces, shopping streets etc. Flatter zones suggest more residential neighbourhoods of a suburban or low-density nature.
Higher densities can facilitate more sustainable public transport, walking and cycling, making it more efficient to provide services and promote urban vitality. These advantages depend, however, on high-quality urban design and effective city management to minimise the negative impacts of overcrowding, stress and pollution.
While some cities have maintained resident population levels in their central areas, others are losing population from these zones as their boundaries expand. This poses a challenge to cities, as they depend on residents’ taxes to finance urban facilities and infrastructure.
At the same time, most cities have a high percentage of people entering to work each day who do not pay taxes there and often are not represented by the city government as they cannot vote locally. Studying commuters is therefore fundamental to the governance of cities. Tokyo has the equivalent of 20% of its population entering the administrative city every day, while Delhi has 13.5% and Bogotá and London in the order of 9%.
Density differs widely within the four case study cities. Delhi and Bogotá have higher and more concentrated densities in the city core and outskirts while Tokyo and London present lower and more balanced distribution of densities.